Uncovering Raw Data From Percentages


When organizations release data but redact or suppress certain parts of it, like information pertaining to small subgroups, some information they reveal can let viewers infer the information that was hidden. One of the things that can give away what they were trying to keep secret is percentages. If you have the percentage of a group that's in some category, and you also have the total size of that group (the denominator), it’s possible to derive the number in that category (the numerator). For instance, if you know that there are 10 people in a group, and 30% of them are employed, you can figure out that 3 of them are employed.
And this does happen. In a recent data release from the Office of the State Superintendent of Education (OSSE) in the District of Columbia of test scores at the school (and grade) level, it was possible to infer some redacted counts (numerators) by using the total count (or denominators, which were not intentionally given but could be determined), and the percentage variables.
But even without the denominator, can you use just the percentage to figure out both the numerator and the denominator? Sometimes! How often you'll be able to do that with redacted data is a function of two things: how much has the percentage been rounded and what is the possible range of the denominator - that is, how big might the total group be? In general, the bigger the denominator might be and the more rounded the percentage, the less this is something you need to worry about.
For instance, to go back to the DC standardized test data example, let’s say that we’re trying to figure out the number of students from a certain grade who passed a test, and also the total number of students in that grade who took it. We know that the denominator can’t be bigger than 100 because that’s the total number of students at the school who took the test.[1] If the data is rounded to four digits (like .1056, or 10.56%), then about 45% of the time, we’ll be able to go from the percentage given to a numerator and denominator, because there will be only one possible combination of numbers that will give you that percentage. For instance, there is only one possible pair of integers with a denominator of 100 or below that will get you to 25.77%, 25.51%, 25.25%, or 99%.
However, as the possible denominators (or total group sizes) get higher, it takes more digits to unredact data.
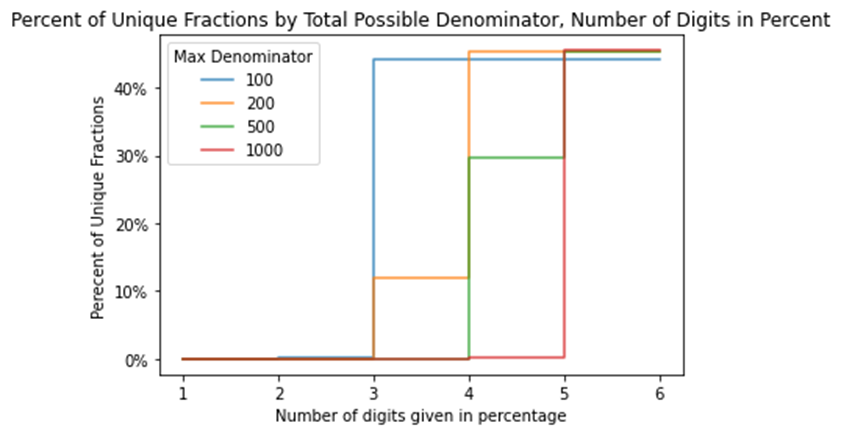
For instance, if the denominator might be as big as 1,000, we'd need six digits, like .105555 or 10.5555%, to be able to identify the numerator and denominator about 45% of the time. And you can't get higher than about 45% no matter how many digits you have access to because of equivalent fractions: one-third is the same as two-sixths or three-ninths no matter how precise your percentage is because that’s what the concept of ‘equivalent’ refers to.
The graph below shows the proportion of uniquely-identifiable fractions as a function of possible denominator size and number of digits. You can see that they all approach about 45%, but that the bigger your possible denominator is, the more digits it takes to get there.
So what if you want to display percentages but you don’t want anyone to be able to fill in the raw counts?
The first question to ask is the same question we should always ask for sharing data when there's a trade-off between utility and privacy or risk: what do we want people to be able to do with this data, and how would redacting it affect their ability to do that?
In some circumstances, the only way someone might use a percentage as precise as 10.5555% would be to un-redact data with it. In others, researchers might need that degree of precision to effectively run statistical tests, particularly if the percentages released for different subgroups are very close to each other. You should think through the possible range of usage when deciding how much precision to give.
And if you're not sure whether a specific percentage or series of percentages gives you away, test it before you release it! This code goes through how I derived these numbers and this graph and also has a function where you can input a numerator and denominator and find out to what degree you’re in danger of someone using its corresponding percentage to un-redact your data, depending on how many digits you give them.
More realistically, if there are three grades and so I know that the number of students per grade is between 20 and 40, it's the jump from two to three digits that takes your data from not identifiable to extremely identifiable. And because the possible denominator starts at 20 and not 1, we can surpass that 45% limit on identifiability. ↩︎